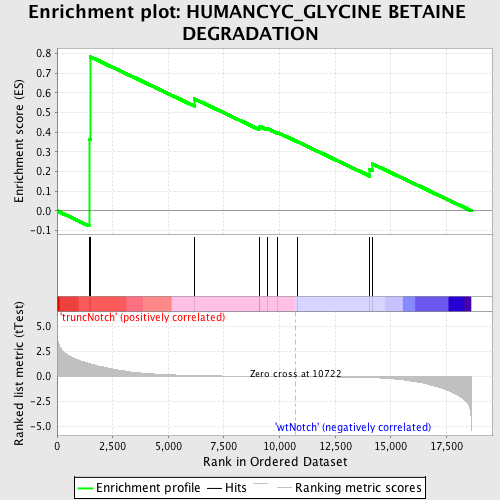
Profile of the Running ES Score & Positions of GeneSet Members on the Rank Ordered List
| Dataset | Set_03_truncNotch_versus_wtNotch.phenotype_truncNotch_versus_wtNotch.cls #truncNotch_versus_wtNotch |
| Phenotype | phenotype_truncNotch_versus_wtNotch.cls#truncNotch_versus_wtNotch |
| Upregulated in class | truncNotch |
| GeneSet | HUMANCYC_GLYCINE BETAINE DEGRADATION |
| Enrichment Score (ES) | 0.78377545 |
| Normalized Enrichment Score (NES) | 1.4424092 |
| Nominal p-value | 0.058419243 |
| FDR q-value | 0.591418 |
| FWER p-Value | 1.0 |
| PROBE | DESCRIPTION (from dataset) | GENE SYMBOL | GENE_TITLE | RANK IN GENE LIST | RANK METRIC SCORE | RUNNING ES | CORE ENRICHMENT | |
|---|---|---|---|---|---|---|---|---|
| 1 | SHMT2 | 1850180 6040010 | 1437 | 1.320 | 0.3644 | Yes | ||
| 2 | SHMT1 | 5900132 | 1504 | 1.264 | 0.7838 | Yes | ||
| 3 | ST6GALNAC2 | 2680402 | 6167 | 0.111 | 0.5702 | No | ||
| 4 | SDS | 110242 6380725 | 9076 | 0.027 | 0.4231 | No | ||
| 5 | DMGDH | 3830601 | 9102 | 0.027 | 0.4308 | No | ||
| 6 | BHMT2 | 2030184 | 9452 | 0.021 | 0.4190 | No | ||
| 7 | BHMT | 6660138 | 9920 | 0.013 | 0.3983 | No | ||
| 8 | PIPOX | 70750 | 10810 | -0.002 | 0.3511 | No | ||
| 9 | SDSL | 6900435 | 14055 | -0.098 | 0.2095 | No | ||
| 10 | SARDH | 3060044 | 14176 | -0.106 | 0.2386 | No |

